Independent project
Hourly taxi demand forecasting for New York City
One-hour-ahead pickup forecasts for all 262 NYC Taxi Zones under a strict no-leakage contract, with walk-forward evaluation and an interactive explorer.
Sole developer
2026
Python, SQL, FastAPI, TypeScript, SVG
The project
Demand forecasts decide where vehicles should be before riders ask for them. This project forecasts yellow-taxi pickups for every NYC Taxi Zone one hour ahead. At the start of hour t it may use only observations through hour t − 1, and evaluation walks forward in time so no model ever sees its own future.
My part
I built it end to end. That covers acquisition and source hashing for 23.3 million trips, past-only feature engineering, gradient-boosted and baseline models, walk-forward evaluation with matched-control ablations, a FastAPI inference prototype, and a TypeScript map explorer that runs from a committed snapshot.
- Data
- 23,263,775 pickups, Dec. 2025 to May 2026
- Target
- Pickups per zone-hour, 262 zones
- Validation
- Walk-forward, expanding history; May sealed
- Ablations
- Delay, XGBoost depth, borough, weather
- Claim
- A boosting model on past-only features forecasts hourly pickups per zone better than a weekly baseline.
- Result
- MAE 3.693 vs 5.104 (27.65% lower) over 559,370 zone-hours of walk-forward validation.
Limit Boosting is worse on sparse-zone MAE in every month, and no live data feed exists.
The problem
At the start of each hour, predict yellow-taxi pickups in every NYC Taxi Zone using only observations through the previous hour. The target is recorded pickups, not all travel or unmet demand, and every one of the 262 zones counts, including its zero-demand hours.
What I built
- Acquisition and hourly aggregation of 23,263,775 accepted pickups from December 2025 through May 2026, with source hashes for every file.
- Past-only features, models, walk-forward evaluation, and a local FastAPI inference prototype in Python.
- SQL borough summaries checked against the demo export.
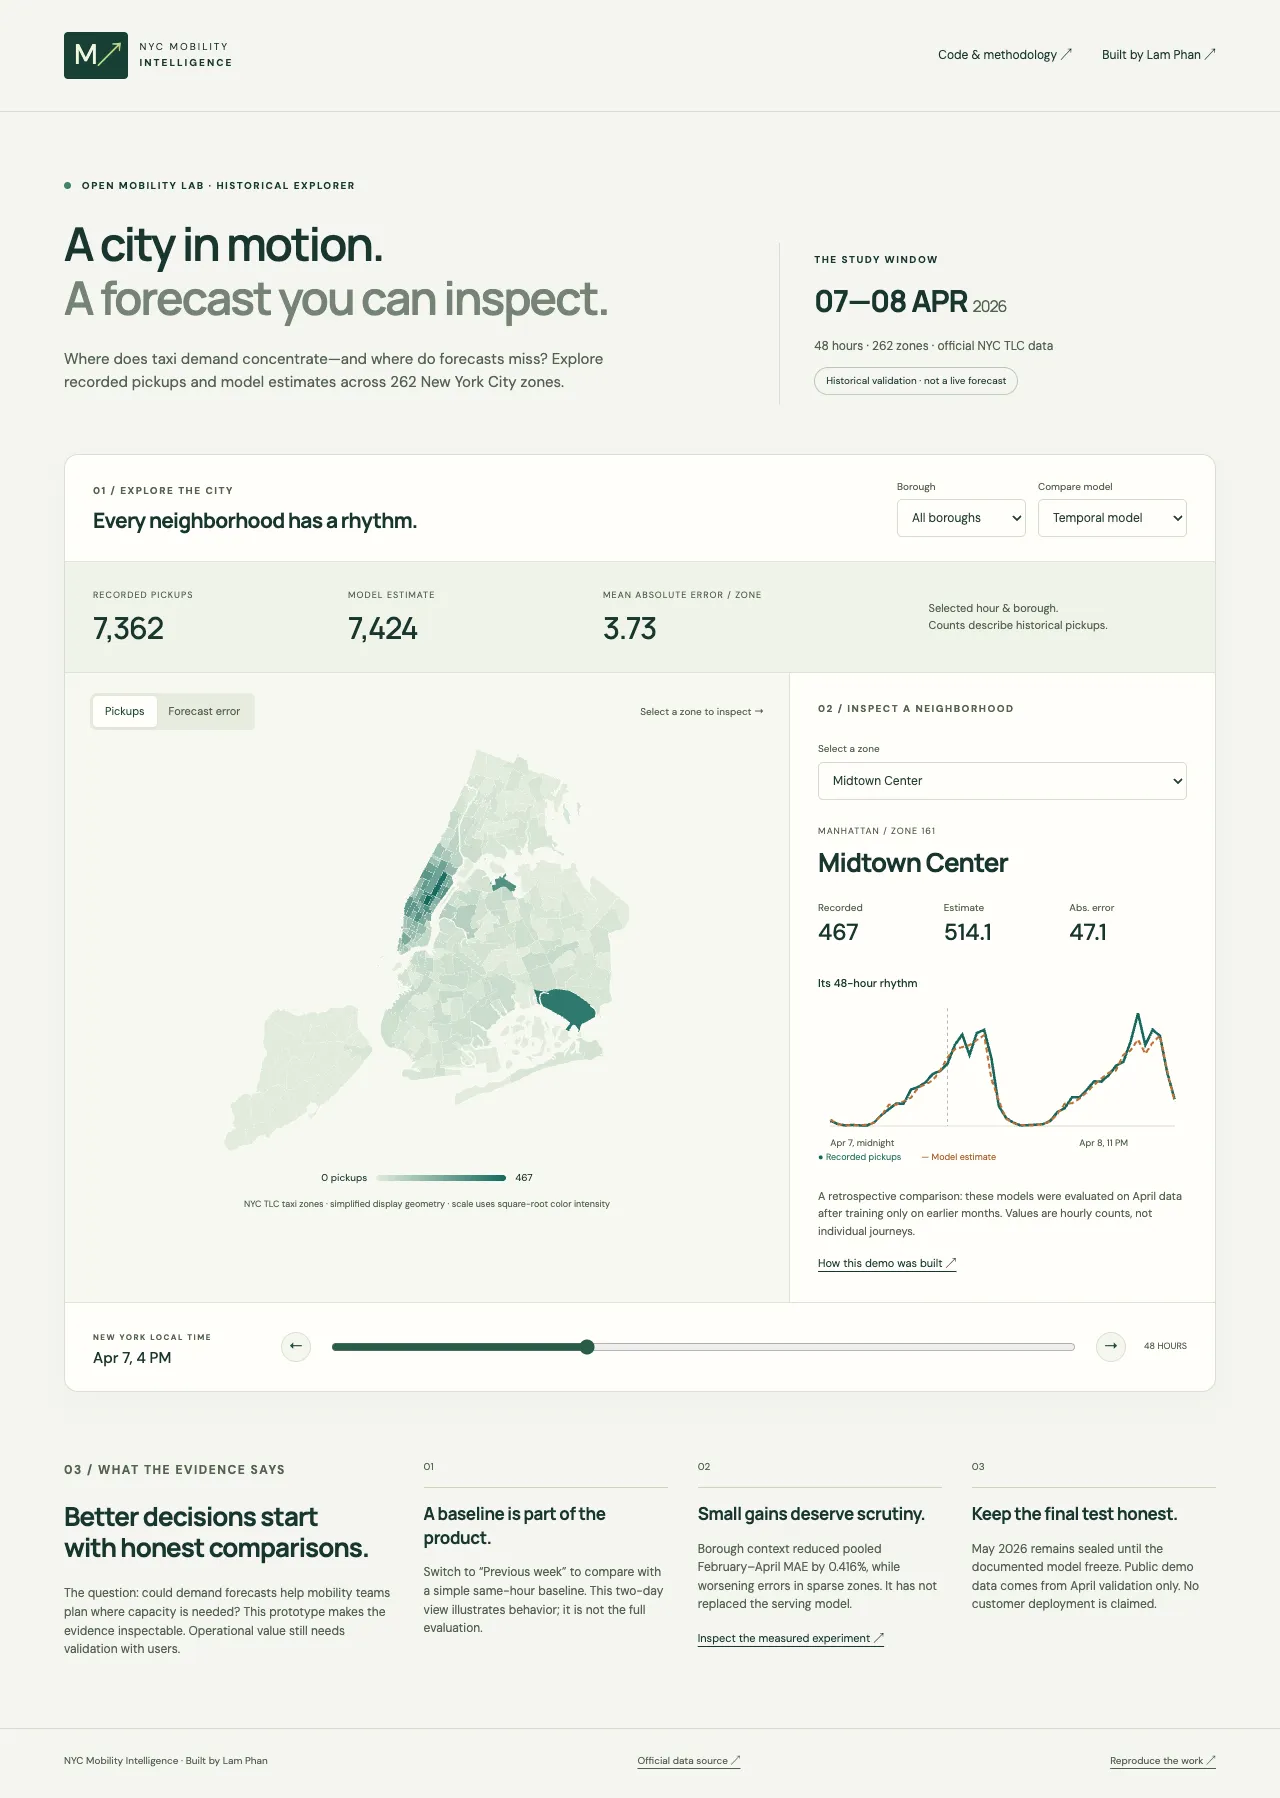
- A TypeScript and SVG explorer: compare three forecast methods, inspect a zone’s 48-hour trace, find the largest misses, and download CSVs.
Measured results
| Comparison | Result | Main limit |
|---|---|---|
| Walk-forward validation, 559,370 zone-hours | MAE 3.693 vs 5.104 for the weekly baseline, 27.65% lower | Worse on sparse-zone MAE in every month |
| Six-hour observation delay | MAE 22.94% higher than the matched zero-delay control | Assumes historical counts; no live feed exists |
| XGBoost, depth 6 | MAE 0.76% lower than the matched temporal control | RMSE increases slightly |
| Borough context | MAE 0.416% lower than the matched temporal control | Sparse-zone and zero-target errors worsen every month |
| Weather inputs | MAE 2.32% to 2.74% worse | Historical weather quality is unverified |
MAE is mean absolute error in pickups per zone-hour. Each study uses its own matched control, so the percentages are not one ranking. The May test month stays sealed until model selection is frozen.
Limits
- Six months of data do not cover a full annual cycle, and the patterns are descriptive, not causal.
- TLC publication delay rules out real-time use; zero counts can also reflect reporting gaps.
- The two-day demo illustrates behavior and does not estimate full-study performance.